Summary
This post looks at using Trading Data Stream to convert Dukascopy Tick Data to Bars in Excel using a Comma Separate Value (CSV) format. For more information on using Trading Data Stream, see our previous post Reading Dukascopy bi5 Tick History with the TradingData Stream Library for Java.
Want to use FX Bar data but want a JSON format rather than Dukascopy binary format? We have produced a java library, Trading Data Stream, that has a lot of functions to work with Dukascopy data.
See our source code at https://bitbucket.org/limemojito/trading-data-stream.
Our Trading Data Stream library includes a sample console program, example-cli, as a Spring Boot Application. This console program accepts;
- a FX Pair
- bar period
- date range
- CSV Output file name
producing a CSV of the bar period data for the time range. The bar data is built up from pair tick information (bid price) sourced from the public Dukascopy tick data set. The tick data is dynamically downloaded and cached on your local machine, so repeated queries are very fast.
Quickstart
- Download or clone Trading Data Stream from https://bitbucket.org/limemojito/trading-data-stream.
- Install Java 11 or higher, Maven 3.9.1 or higher
- Open a shell or command prompt at the folder you’ve installed to.
- Perform a maven build to assemble and install the code
mvn clean install -DskipTests - You should see BUILD SUCESSFUL
- We now run the example CLI to generate a CSV.
- Note this post was written against version 2.1.3
- Linux/Mac:
java -jar example-cli/target/example-cli-2.1.3.jar --symbol=NZDUSD --period=M5 --start=2018-01-02T00:00:00Z --end=2018-01-02T00:59:59Z --output=test-nz.csv - Windows:
java -jar example-cli\target\example-cli-2.1.3.jar --symbol=NZDUSD --period=M5 --start=2018-01-02T00:00:00Z --end=2018-01-02T00:59:59Z --output=test-nz.csv - Note this first run may take a little time as it is downloading data.
- The final output should look like
- CSV file output:
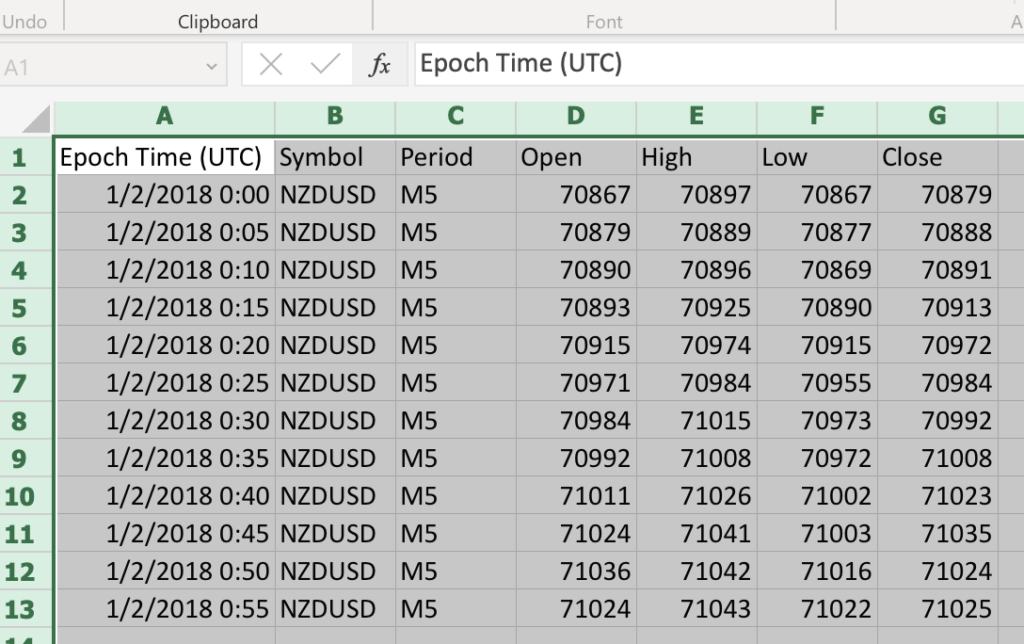
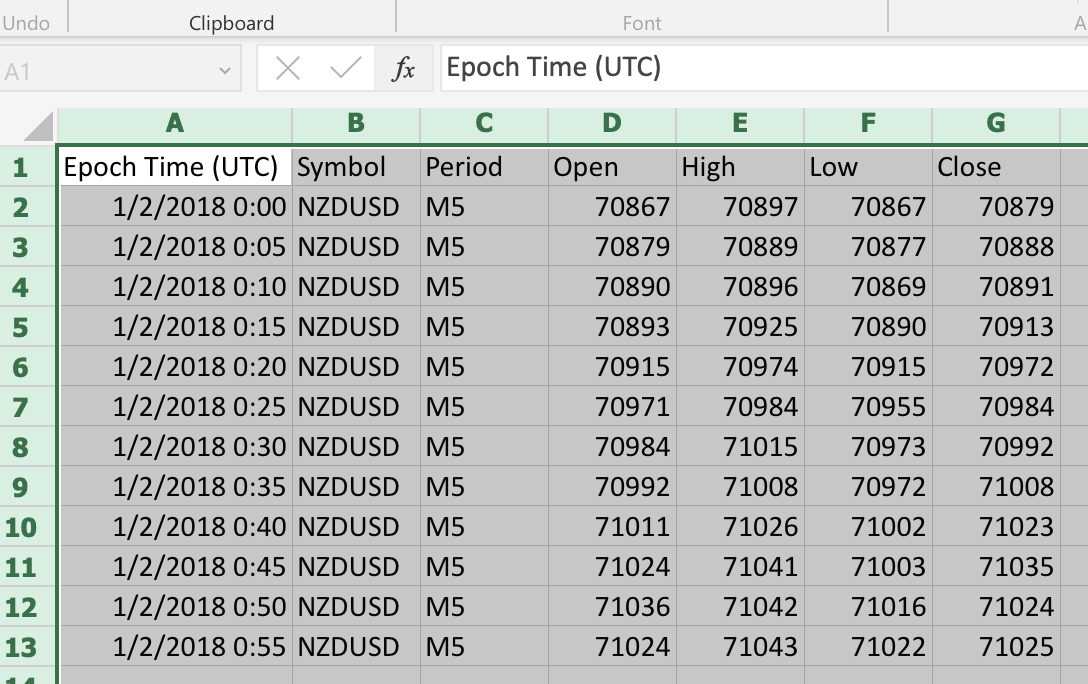
Epoch Time (UTC),Symbol,Period,Open,High,Low,Close
2018-01-02 00:00:00,NZDUSD,M5,70867,70897,70867,70879
2018-01-02 00:05:00,NZDUSD,M5,70879,70889,70877,70888
2018-01-02 00:10:00,NZDUSD,M5,70890,70896,70869,70891
2018-01-02 00:15:00,NZDUSD,M5,70893,70925,70890,70913
2018-01-02 00:20:00,NZDUSD,M5,70915,70974,70915,70972
2018-01-02 00:25:00,NZDUSD,M5,70971,70984,70955,70984
2018-01-02 00:30:00,NZDUSD,M5,70984,71015,70973,70992
2018-01-02 00:35:00,NZDUSD,M5,70992,71008,70972,71008
2018-01-02 00:40:00,NZDUSD,M5,71011,71026,71002,71023
2018-01-02 00:45:00,NZDUSD,M5,71024,71041,71003,71035
2018-01-02 00:50:00,NZDUSD,M5,71036,71042,71016,71024
2018-01-02 00:55:00,NZDUSD,M5,71024,71043,71022,71025
If you open this in Excel you’ll get a clean spreadsheet.